Fat tails in financial markets
Fat tails in financial markets
Reference: Chapter: A Tale of Fat Tails from The Ascent of Money
TODO: include an example image here
Sometimes the most important historical events are the non-events: the things that did not occur. The economist Hyman Minsky put it well when he observed: ‘The most significant economic event of the era since World War II is something that has not happened: there has not been a deep and long-lasting depression’. This is indeed surprising, since the world has not been short of ‘Black Days’.
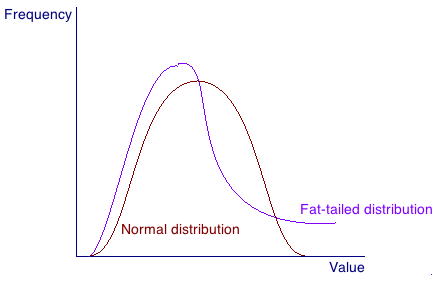
If movements in stock market indices were statistically distributed like human heights there would hardly be any such days. Most would be clustered around the average, with only a tiny number of extreme ups or downs. After all, not many of us are below four feet in height or above eight feet. If I drew a histogram of the heights of the male students in my financial history class according to their frequency, the result would be a classic bell-shaped curve, with nearly everyone clustered within around five inches of the US average of around 5’ 10". But in financial markets, it doesn’t look like this. If you plot all the monthly movements of the Dow Jones index on a chart, there is much less clustering around the average, and there are many more big rises and falls out at the extremes, which the statisticians call ‘fat tails’. If stock market movements followed the ’normal distribution’ or bell curve, like human heights, an annual drop of 10 per cent or more would happen only once every 500 years, whereas on the Dow Jones it has happened about once every five years. And stock market plunges of 20 per cent or more would be unheard of - rather like people just a foot tall - whereas in fact there have been nine such crashes in the past century.
On ‘Black Monday’, 19 October 1987, the Dow fell by a terrifying 23 per cent, one of just four days when the index has fallen by more than 10 per cent in a single trading session. The New York Times’s front page the next morning said it all when it asked ‘Does 1987 Equal 1929?’ From peak to trough, the fall was of nearly one third, a loss in the value of American stocks of close to a trillion dollars. The causes of the crash were much debated at the time. True, the Fed had raised rates the previous month from 5.5 to 6 per cent. But the official task force chaired by Nicholas Brady laid much of the blame for the crash on ‘mechanical, price-insensitive selling by a [small] number of institutions employing portfolio insurance strategies and a small number of mutual fund groups reacting to redemptions’, as well as ‘a number of aggressive trading-oriented institutions [which tried] to sell in anticipation of further market declines’. Matters were made worse by a breakdown in the New York Stock Exchange’s automated transaction system, and by the lack of ‘circuit breakers’ which might have interrupted the sell-off on the futures and options markets. The remarkable thing, however, was what happened next - or rather, what didn’t happen. There was no Great Depression of the 1990s, despite the forebodings of Lord Rees-Mogg and others. There wasn’t even a recession in 1988 (only a modest one in 1990-91). Within little more than a year of Black Monday, the Dow was back to where it had been before the crash. For this, some credit must unquestionably be given to the central bankers, and particularly the then novice Federal Reserve Chairman Alan Greenspan, who had taken from Paul Volcker just two months before. Greenspan’s response to the Black Monday crash was swift and effective. His terse statement on 20 October, affirming the Fed’s ‘readiness to serve as a source of liquidity to support the economic and financial system’, sent a signal to the markets, and particularly the New York banks, that if things got really bad he stood ready to bail them out. Aggressively buying government bonds in the open market, the Fed injected badly needed cash into the system, pushing down the cost of borrowing from the Fed by nearly 2 per cent in the space of sixteen days. Wall Street breathed again. What Minsky called ‘It’ had not happened.
Having contained a panic once, the dilemma that lurked in the back of Greenspan’s mind thereafter was whether or not to act pre-emptively the next time to prevent the panic altogether. This dilemma came to the fore as a classic stock market bubble took shape in the mid 1990s. The displacement in this case was the explosion of innovation by the technology and software industry as personal computers met the Internet. But, as in all history’s bubbles, an accommodative monetary policy also played a role. From a peak of 6 per cent in June 1995, the Federal funds target rate [This is the interest rate at which banks lend balances held at the Federal Reserve to one another, usually overnight. The Federal Open Market Committee, which is made up of the seven Federal Reserve Board governors and the presidents of the twelve regional Federal Reserve banks, sets a target rate at its regular meetings. The Federal Reserve Bank of New York has the job of making this rate effective through open market operations (buying or selling bonds in the New York market)] had been reduced to 5.25 per cent (January 1996-February 1997). It had been raised to 5.5 per cent in March 1997, but then cut in steps between September and November 1998 down to 4.75 per cent; and it remained at that level until May 1999, by which time the Dow had passed the 10,000 mark. Rates were not raised until June 1999.
Why did the Fed allow euphoria to run loose in the 1990s? Greenspan himself had felt constrained to warn about irrational exuberance on the stock market as early as 5 December 1996, shortly after the Dow had risen above 6,000. His wording was characteristically opaque:
‘Clearly, sustained low inflation implies less uncertainty about the future, and lower risk premiums imply higher prices of stocks… But how do we know when irrational exuberance has unduly escalated asset values…? We as central bankers need not be concerned if a collapsing financial asset bubble does not threaten to impair the real economy… But we should not underestimate, or become complacent about, the complexity of the interactions of asset markets and the economy’.
Yet the point rate increase of March 1997 was scarcely sufficient to dispel that exuberance. Partly, Greenspan and his colleagues seem to have underestimated the momentum of the technology bubble. As early as December 1995, with the Dow just past the 5,000 mark, members of the Fed’s Open Market Committee speculated that the market might be approaching its peak. Partly, it was because Greenspan felt it was not for the Fed to worry about asset price inflation, only consumer price inflation; and this, he believed, was being reduced by a major improvement in productivity due precisely to the tech boom. Partly, as so often happens in stock market bubbles, it was because international pressures - in this case, the crisis precipitated by the Russian debt default of August 1998 - required contrary action. Partly, it was because Greenspan and his colleagues no longer believed it was the role of the Fed to remove the punchbowl from the party, in the phrase of his precursor but three, William McChesney Martin, Jr. To give Greenspan his due, his ‘just-in-time monetary policy’ certainly averted a stock market crash. Not only were the 1930s averted; so too was a repeat of the Japanese experience, when a conscious effort by the central bank to prick an asset bubble ended up triggering an 80 per cent stock market sell-off and a decade of economic stagnation. But there was a price to pay for this strategy. Not for the first time in stock market history, an asset-price bubble created the perfect conditions for malfeasance as well as exuberance.
See Enron scandal